AI Alert Analysis
The AI alert analysis feature uses a large language model to examine alerts and provide actionable remediation guidance. The analysis considers historical patterns, server context, and metric baselines to generate reports tailored to each alert.
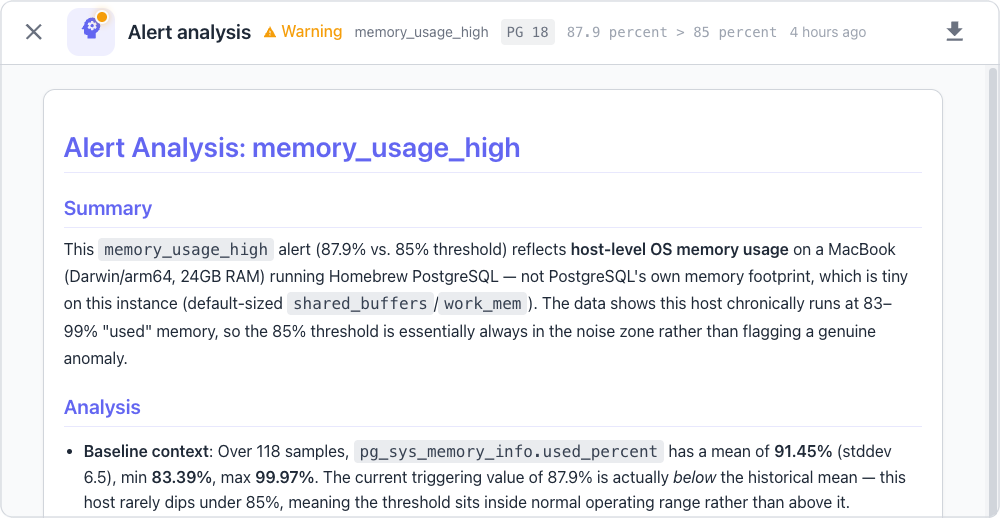
Overview
Each alert in the status panel, other than a system alert, displays a brain icon that triggers an AI-powered analysis. The system sends the alert details, server context, and historical data to an LLM through an agentic loop. The LLM gathers additional context by calling built-in tools before producing the final report.
The AI alert analysis feature provides the following alert-specific capabilities:
- The LLM analyzes alert severity, metric values, and threshold configurations.
- The system gathers historical alert patterns and metric baselines automatically.
- The analysis includes server-specific context such as PostgreSQL version and system resources.
For how the general analysis mechanic works, including SQL execution and result caching, see Using AI-Powered Object Analysis.
Triggering an Analysis
The status panel displays a brain icon beside each alert. Clicking the brain icon opens the analysis dialog and starts the LLM analysis process. A system alert concerns no monitored connection, so the status panel shows no brain icon for it; the alert's description gives the cause instead.
The alert analysis follows the same check-cache, fetch-context, send-to-LLM, gather-more-via-tools, and produce-report pattern described in In-depth Object Analysis, applied specifically to alerts.
The dialog displays a loading skeleton while the analysis runs. The final report renders as formatted markdown with syntax-highlighted code blocks.
Analysis Reports
Each alert analysis report contains a structured assessment that includes:
- The
Summarysection summarizes the alert and its significance in one or two sentences. - The
Analysissection examines what the data shows about the alert, including the frequency of similar alerts, comparisons with baseline patterns, and correlations with other events. - The
Remediation Stepssection lists specific actions that address the issue. - The
Threshold Tuningsection recommends threshold changes, with a rationale, when the current threshold appears misconfigured.
Running SQL Queries
The analysis report often includes SQL code blocks with diagnostic queries and remediation commands. Users can execute these queries directly from the report.
Run Button
Each code block displays a copy-to-clipboard button in the upper-right corner. SQL code blocks also display a play button to the right of the copy button. Clicking the play button executes the SQL against the alert's connection and database. The tooltip on the play button shows the target server and database name.
Query Validation
The Workbench checks each generated SQL block against the alert's database as
the report renders, so that a query the model invented cannot be offered as
though it were known to work. The check plans the statement with EXPLAIN
inside a read-only transaction that is rolled back afterwards, so validation
does not execute the statement. PostgreSQL can still evaluate some functions
while it plans a statement, such as functions marked IMMUTABLE. A function
that is marked that way but has side effects, such as one that signals another
backend or acts outside the database, can take effect during validation, and
the rollback does not undo it.
A generated SQL block therefore appears in one of four states:
- Validated blocks passed the check and show the play button, which runs the query as described above.
- Blocks that PostgreSQL rejected show the error beneath the block, and the play button gives way to a Run anyway button for a user who is confident the query is correct.
- Blocks of a kind PostgreSQL cannot plan in advance show a "Not validated" notice giving that reason, and keep the play button, because such a statement can still be run.
- Template blocks use placeholders such as
$1,<name>,{{name}},${name}or:name, and show no play button, because such a query needs values substituted in before it can run.
When the validation request itself fails, for example because of a network error or an error response from the server, the block keeps the play button and shows no notice. The play button therefore does not always mean that a query passed validation; review each query before you run it.
The check plans SELECT, WITH, INSERT, UPDATE, DELETE and TABLE
statements, and EXPLAIN without ANALYZE. It reports every other statement
as not validated, including EXPLAIN ANALYZE, the DDL statements and
ALTER SYSTEM, VACUUM, SET, SHOW, GRANT, REINDEX, CLUSTER and
ANALYZE; review these statements yourself before running them. A statement
that begins with MERGE or VALUES never reaches the check, because
SQL extraction drops it before the block is validated or
run.
The play button is unavailable whilst a check is still in flight.
Inline Results
The system displays query results in a table directly below the code block. Each result shows the column headers, data rows, and a row count. The system truncates large result sets and displays a notice.
Write Statement Confirmation
The system detects write statements such as ALTER, CREATE, DROP,
INSERT, UPDATE, and DELETE. When a code block contains write statements,
the system displays a confirmation prompt listing the detected statements and
naming the server, and the database where known, that they will run on. The
user must click Execute to proceed or Cancel to abort. Running a write
statement also requires write access to the connection.
A query that calls a function with side effects beyond its own transaction also
counts as a write, even though it begins with SELECT, because a read-only
transaction does not stop such a function. The system recognizes these
functions only from a built-in list of function names, name prefixes and
schemas, so it cannot catch every function with side effects; a call to a
function that the list does not cover runs as a read, without a confirmation
prompt. The listed functions include those that
signal or terminate other sessions (pg_cancel_backend,
pg_terminate_backend), reload the configuration or rotate the log, switch WAL
or control recovery, manage replication slots and origins, reset statistics,
take advisory locks, send notifications, change settings with set_config,
advance sequences with nextval, write large objects or server files, open
dblink connections, evict or prewarm shared buffers, run SQL in the
background with pg_background, and manage Spock, pglogical or pg_cron. Any
call to a function in the spock, pglogical or cron schema counts as a
write, even one that only reports status, as do Spock management functions
called without the schema name, such as sub_create or repset_add_table.
Functions such as query_to_xml that run SQL passed to them as text count as
writes too, because the system cannot check that SQL. The match ignores case,
schema qualification and quoting, and finds calls anywhere in the statement,
including subqueries and CTEs, whether written with parentheses or in
field-selection notation such as (pid).pg_terminate_backend, which PostgreSQL
runs as pg_terminate_backend(pid); a column that shares one of these names,
such as t.nextval, also counts as a write. A view or a user-defined function
that calls one of these functions is not detected, so review queries against
unfamiliar views and functions before running them.
Confirmed statements run in order on a single database connection. The
SQL extraction step removes BEGIN, COMMIT, and
ROLLBACK statements before the block runs, so do not rely on them to group
the block's statements into one transaction or to undo a change. If the
statements leave a transaction open, the system rolls it back and reports an
error. The rollback undoes the transaction's database changes, but not effects
that a rollback cannot reach, such as a sequence advanced with nextval, a
backend signalled with pg_terminate_backend, or an action outside the
database.
SQL Extraction
The system extracts only executable SQL from code blocks. The extraction
process filters out configuration file snippets, shell commands, and
explanatory prose. The system identifies SQL statements by matching recognized
keywords at the start of each statement: SELECT, WITH, INSERT, UPDATE,
DELETE, ALTER, CREATE, DROP, SHOW, EXPLAIN, SET, VACUUM,
REINDEX, GRANT, REVOKE, TRUNCATE, CLUSTER, REFRESH, COMMENT,
TABLE and ANALYZE.
The system drops every other statement without a warning, including a MERGE
or VALUES statement, even in a block that also holds recognized statements;
the remaining statements run without it. Running a block that holds no
recognized statement reports that the block contains no executable SQL. Check
that every statement you expect to run starts with a recognized keyword.
Caching
The system caches analysis results at two levels to avoid redundant LLM calls and improve response times.
Cache Indicators
A green brain icon indicates that a stored analysis exists for the alert; an alert without one shows a purple brain icon. Clicking the green icon opens the stored report instantly, without calling the LLM, only when the alert's current metric value is within the tolerance that Tolerance-Based Invalidation describes. When the value has moved beyond that tolerance, clicking the icon starts a new LLM analysis.
Tolerance-Based Invalidation
The cache uses a tolerance-based invalidation strategy. The system considers a cached analysis valid when the current metric value is within 10% of the value at the time of the original analysis. The system generates a new analysis when the metric value changes beyond this tolerance.
Server-Side and Client-Side Caches
The system maintains both server-side and client-side caches. The server stores the analysis text and metric value in the database alongside the alert record. The client maintains an in-memory cache that persists across dialog open and close cycles within a session.
Downloading Reports
The same download feature applies here; see Downloading Analysis Reports.
Server Context
The analysis includes server context to help the LLM generate version-appropriate recommendations. The system fetches the context from the connection before starting the analysis.
The server context includes the following information:
- The PostgreSQL version and key configuration settings such as
shared_buffersandwork_mem. - The maximum connection count and installed extensions.
- The operating system name, version, and architecture.
- The CPU model and core count.
- The total memory and disk usage for each mount point.
The LLM uses this context to ensure that suggested SQL queries use valid syntax and column names for the specific PostgreSQL version. The LLM also considers available system resources when recommending configuration changes.
Available Tools
The LLM has access to built-in tools that gather data during the analysis process. The agentic loop allows the LLM to call these tools multiple times before producing the final report.
The following tools are available to the LLM:
- The
get_alert_historytool retrieves historical alerts for the same rule or metric on a connection. - The
get_alert_rulestool returns current alerting rules and threshold configurations. - The
get_metric_baselinestool provides statistical baselines including mean, standard deviation, minimum, and maximum values. - The
query_metricstool queries historical metric values with time-based aggregation.
Timeline Event Context
The analysis includes timeline events to help the LLM correlate alerts with recent system changes. The system fetches events from a 24-hour window centered on the alert trigger time.
The analysis considers the same event types described in In-depth Object Analysis, plus authentication configuration changes.
The LLM uses timeline events to identify potential root causes. A configuration change shortly before an alert may explain the metric deviation. The LLM notes these correlations in the analysis report.
Running Without AI
When the server starts without the LLM credentials or URL that the configured provider needs, the Workbench automatically hides the AI analysis buttons. The alert list displays without brain icons, and users can still view, acknowledge, and manage alerts normally.
The alerter uses its own LLM providers, set in the alerter's configuration rather than the server's; see LLM Provider Properties. The alerter auto-disables anomaly detection across all three tiers when none of its embedding, reasoning, or decision providers is available. Disabling anomaly detection prevents noise from raw statistical detection. The alerter logs the following message at startup when this occurs:
Anomaly detection auto-disabled: no LLM providers
available
Threshold-based alerting continues to operate normally without AI.