Managing a Cluster
Use the pgEdge Starfleet BYOC console to review cluster information. Select the
name of a cluster in the Clusters menu to access the console for that
cluster.
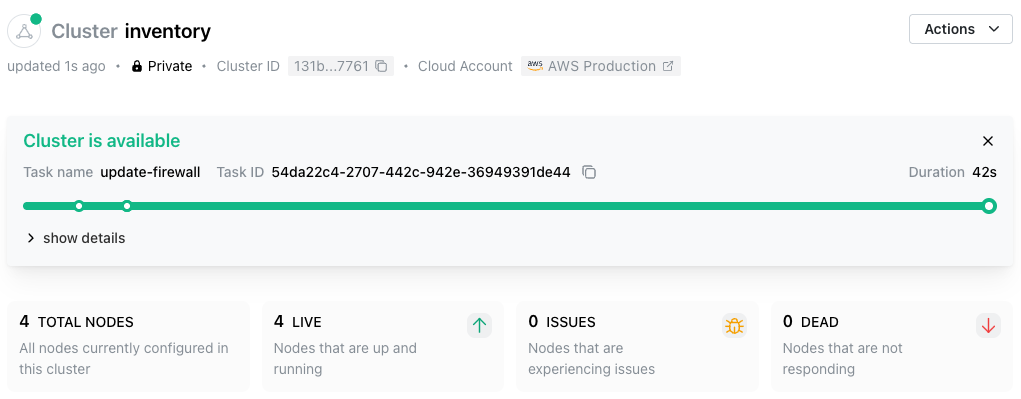
If you recently created or modified the cluster, the header displays a banner showing the cluster state. The console header also displays information about the selected cluster:
- The cluster name.
- The length of time since the last cluster update.
- The cluster connection type (
PublicorPrivate), which indicates whether the cluster nodes are in a public subnet. - The
Cluster IDassociated with the cluster. - The name of the cloud provider account on which the cluster resides; select the account name to navigate to the details page for the account.
- User-defined resource tags associated with the cluster.
The cluster header also displays a set of informational panes that show the state of the cluster at a glance:
- The total node count.
- The number of healthy nodes.
- The number of unhealthy nodes.
- The number of unresponsive nodes.
The Cluster Information Tabs
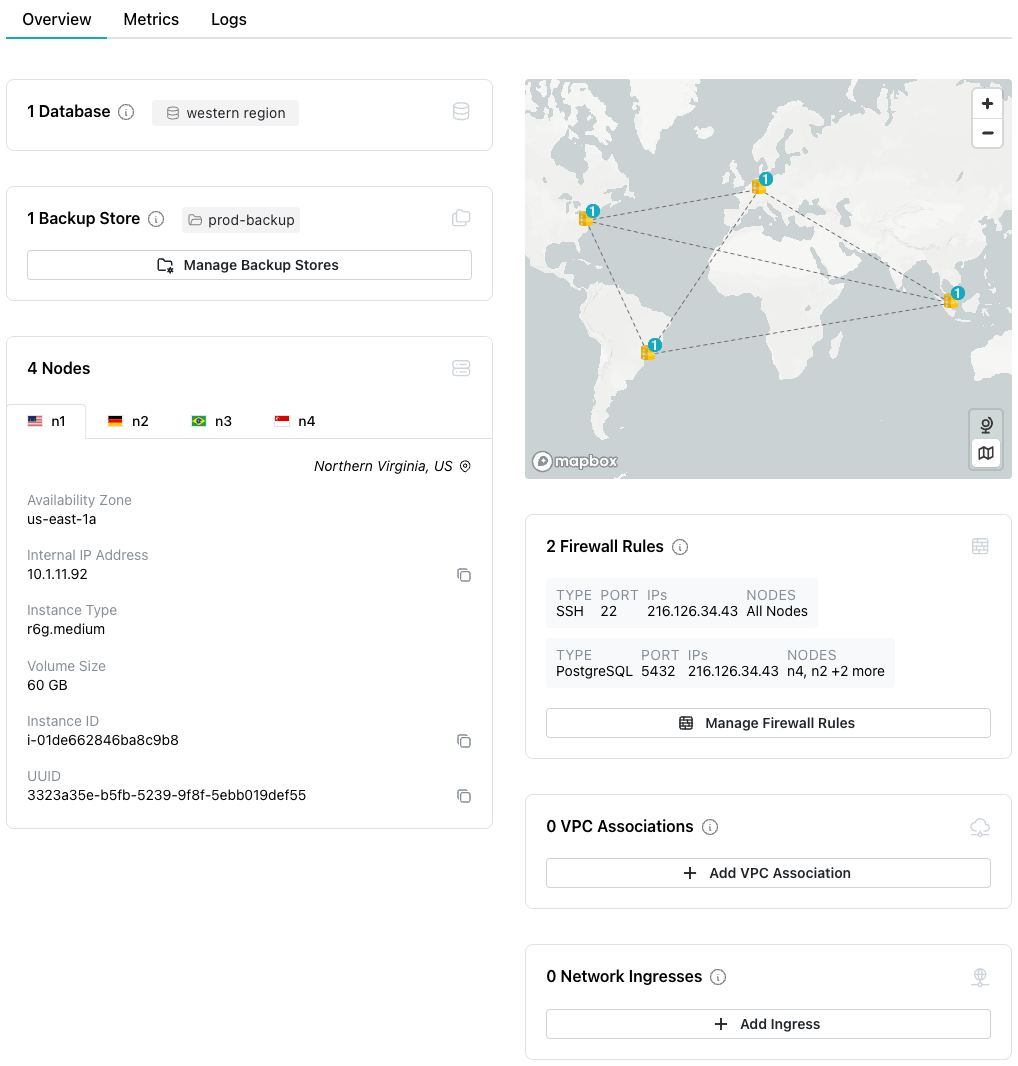
The tabbed browser on the Cluster tab provides quick access to information
about the state of the cluster:
- Select the
Overviewtab to view information about the cluster and the databases currently deployed on the cluster. Detailed information about the cluster nodes displays below. Select an icon in theDatabasepane to navigate to detailed information about the selected database. - Select the
Metricstab to view details about cluster resource use. - Select the
Logstab to review cluster log files.
The Overview Tab
Select the Overview tab to review information about the cluster. Panes on the
Overview tab contain links to cluster artifacts:
- Select a database name in the
Databasespane to navigate to the information page for that database. - Select a backup store name in the
Backup Storepane to navigate to the information page for the store.
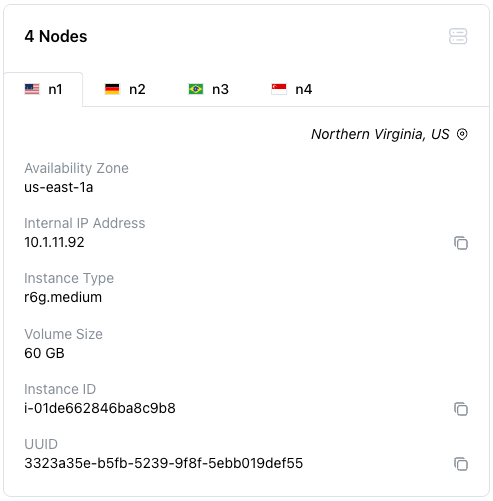
The Nodes pane contains general node information. Use the tabbed browser to
select a node and review information about that node:
- The
Availability Zonelists the provider region in which the node is deployed. - Use the
External IP Addresswhen making connections to the node from a public address. - Use the
Internal IP Addresswhen configuring VPN connections to the node. - The
Instance TypeandVolume Sizedetails provide node size information. - The
Instance IDidentifies the node and associated resources in the cloud provider console. - The
UUIDis a unique identifier for cluster resources outside of the cloud provider console; use the UUID when making API calls.
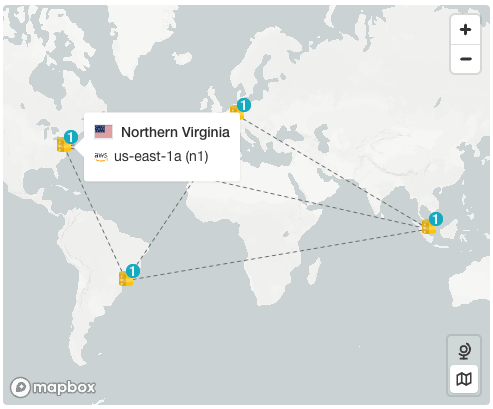
When the Overview tab is selected, a map displays the locations of the
cluster nodes. Hover over a mapped node to display the name and city in which
the node resides.
The Overview tab also displays the currently defined
Firewall Rules.
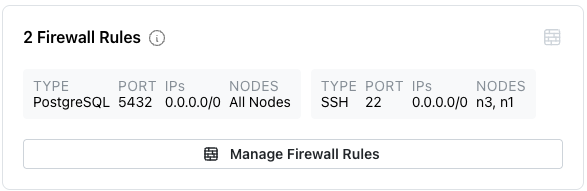
Select the Manage Firewall Rules button to open a dialog to
modify or create rules for the cluster.
The Overview tab also displays the current
VPC Associations.
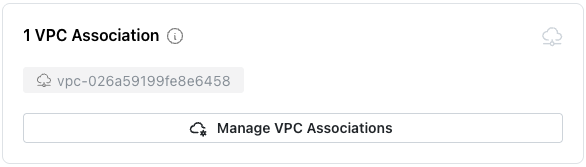
Select the + Add VPC Association button to add a new association.
Reviewing Cluster Metrics
Select the Metrics tab to review detailed system resource usage for the
cluster.
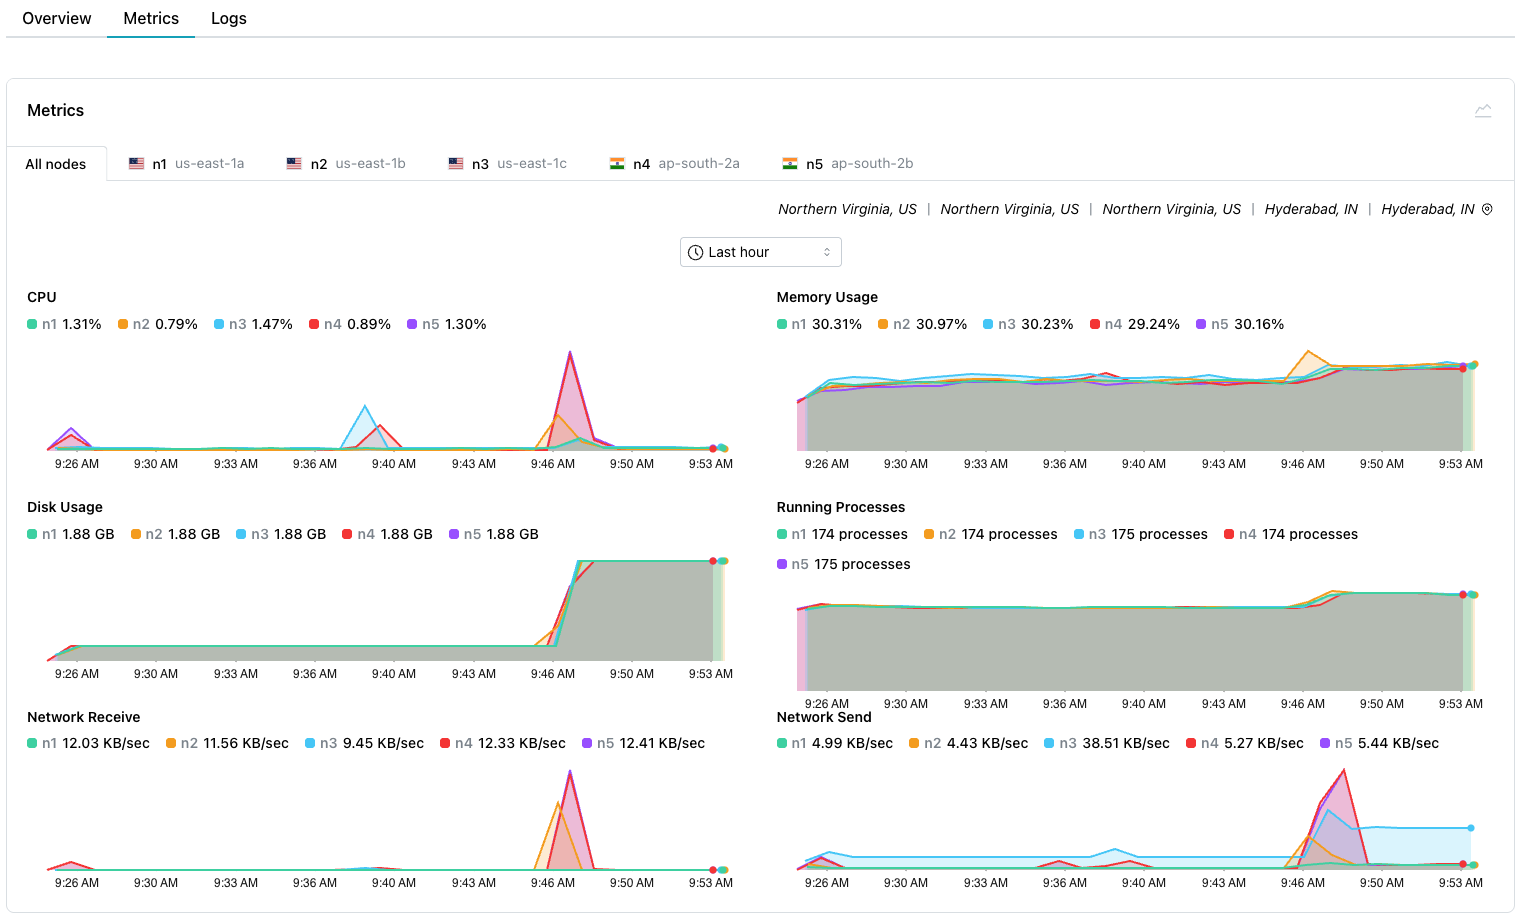
Select from the tabs across the top to review graphs containing:
- Metrics for all nodes in the cluster.
- Metrics for a specific node in the cluster.
The drop-down at the top of the Metrics pane specifies the length of time
displayed by each graph.
Select a point on a graph to display information about the graphed event:
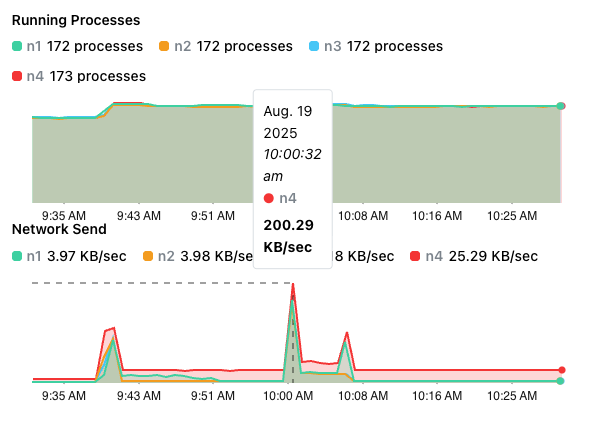
The following table describes the available graphs:
| Graph Name | Description |
|---|---|
| CPU | The percentage of CPU used by the database |
| Memory Usage | Memory used (in MB) |
| Disk Usage | The amount of disk space used (in GB) |
| Running Processes | The number of running processes |
| Network Receive | The amount of data received by the instance |
| Network Send | The amount of data transmitted from the instance |
Reviewing Cluster Log Files
Select the Logs tab to review log files for the cluster.
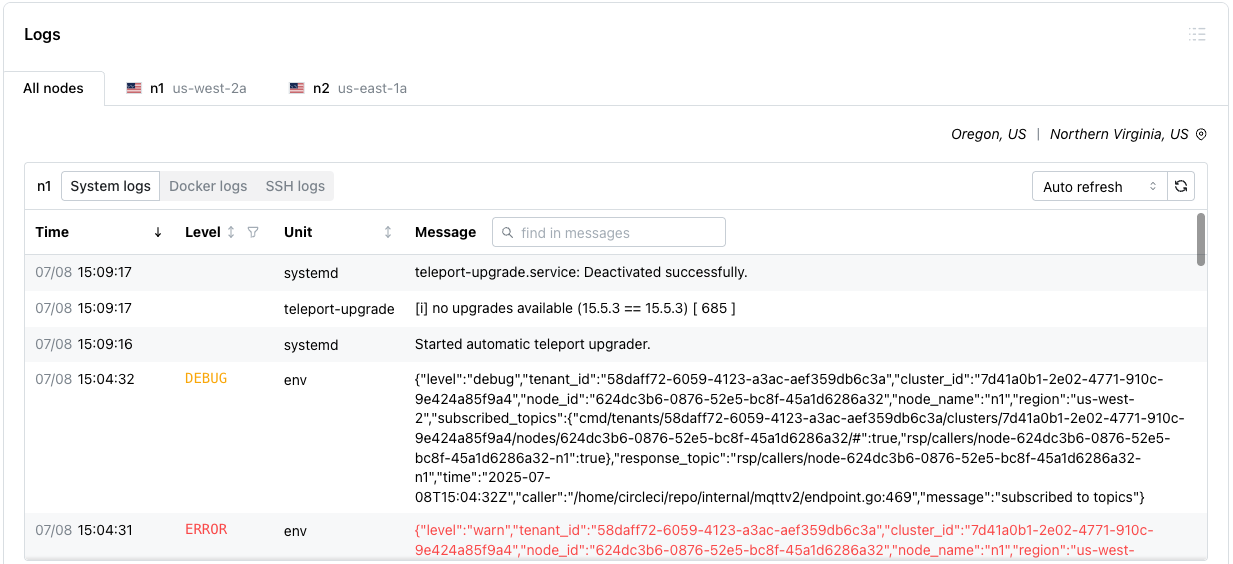
Use the tabs across the top to select the nodes for which to review log files, then select one of the following log types:
System logsreviews the system commands performed to manage the cluster.Docker logsreviews the Docker-specific commands executed to manage the container in which the cluster is running.SSH logsreviews details about SSH connections made to the cluster.
Use the Auto refresh/Manual refresh drop-down to specify whether log
entries update automatically (Auto refresh) or pause updating
(Manual refresh) for easier viewing. To manually refresh the log table's
content, select the refresh button to the right of the drop-down.
Use the controls in the table header to sort or search the selected log file:
- Select a column heading to sort alphabetically by the column value; select a second time to reverse the sort order.
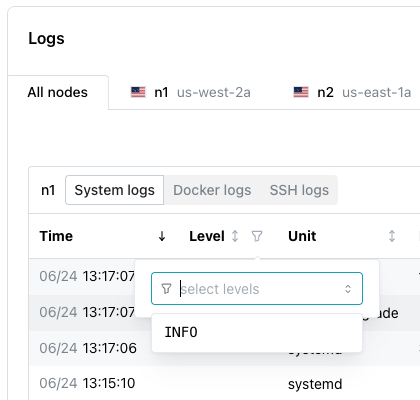
- Select the filter icon to the right of the
Levelheading to choose a status from the drop-down; all rows assigned the selected status are filtered to the top of the result set.
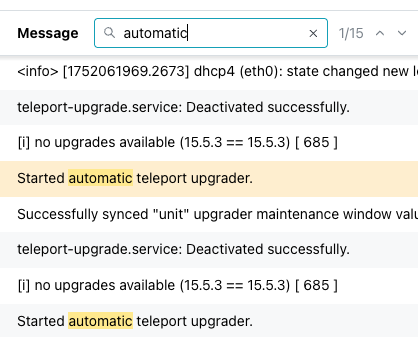
- Use the search box to the right of the
Messagelabel to enter a search string; the search term is highlighted in the log file entries. Use the navigation arrows to move to the next or previous occurrence of the search term.
Cluster Administration Links
Use the links at the end of the navigation pane to access pgEdge Starfleet BYOC resources:
- To manage account details, select the
Settingslink. - Select the
Team Managementlink to manage account membership. - For an invitation to the pgEdge Discord server, select the
Communitylink. - To review the documentation, select the
Docslink.