Monitoring System Metrics
The Metrics pane on your database's management page displays live graphs of
current database activity, including Transactions (transactions per second)
and Tuples returned (rows returned per second).
A branch's page has the same Metrics pane, which displays the branch's
own metrics.
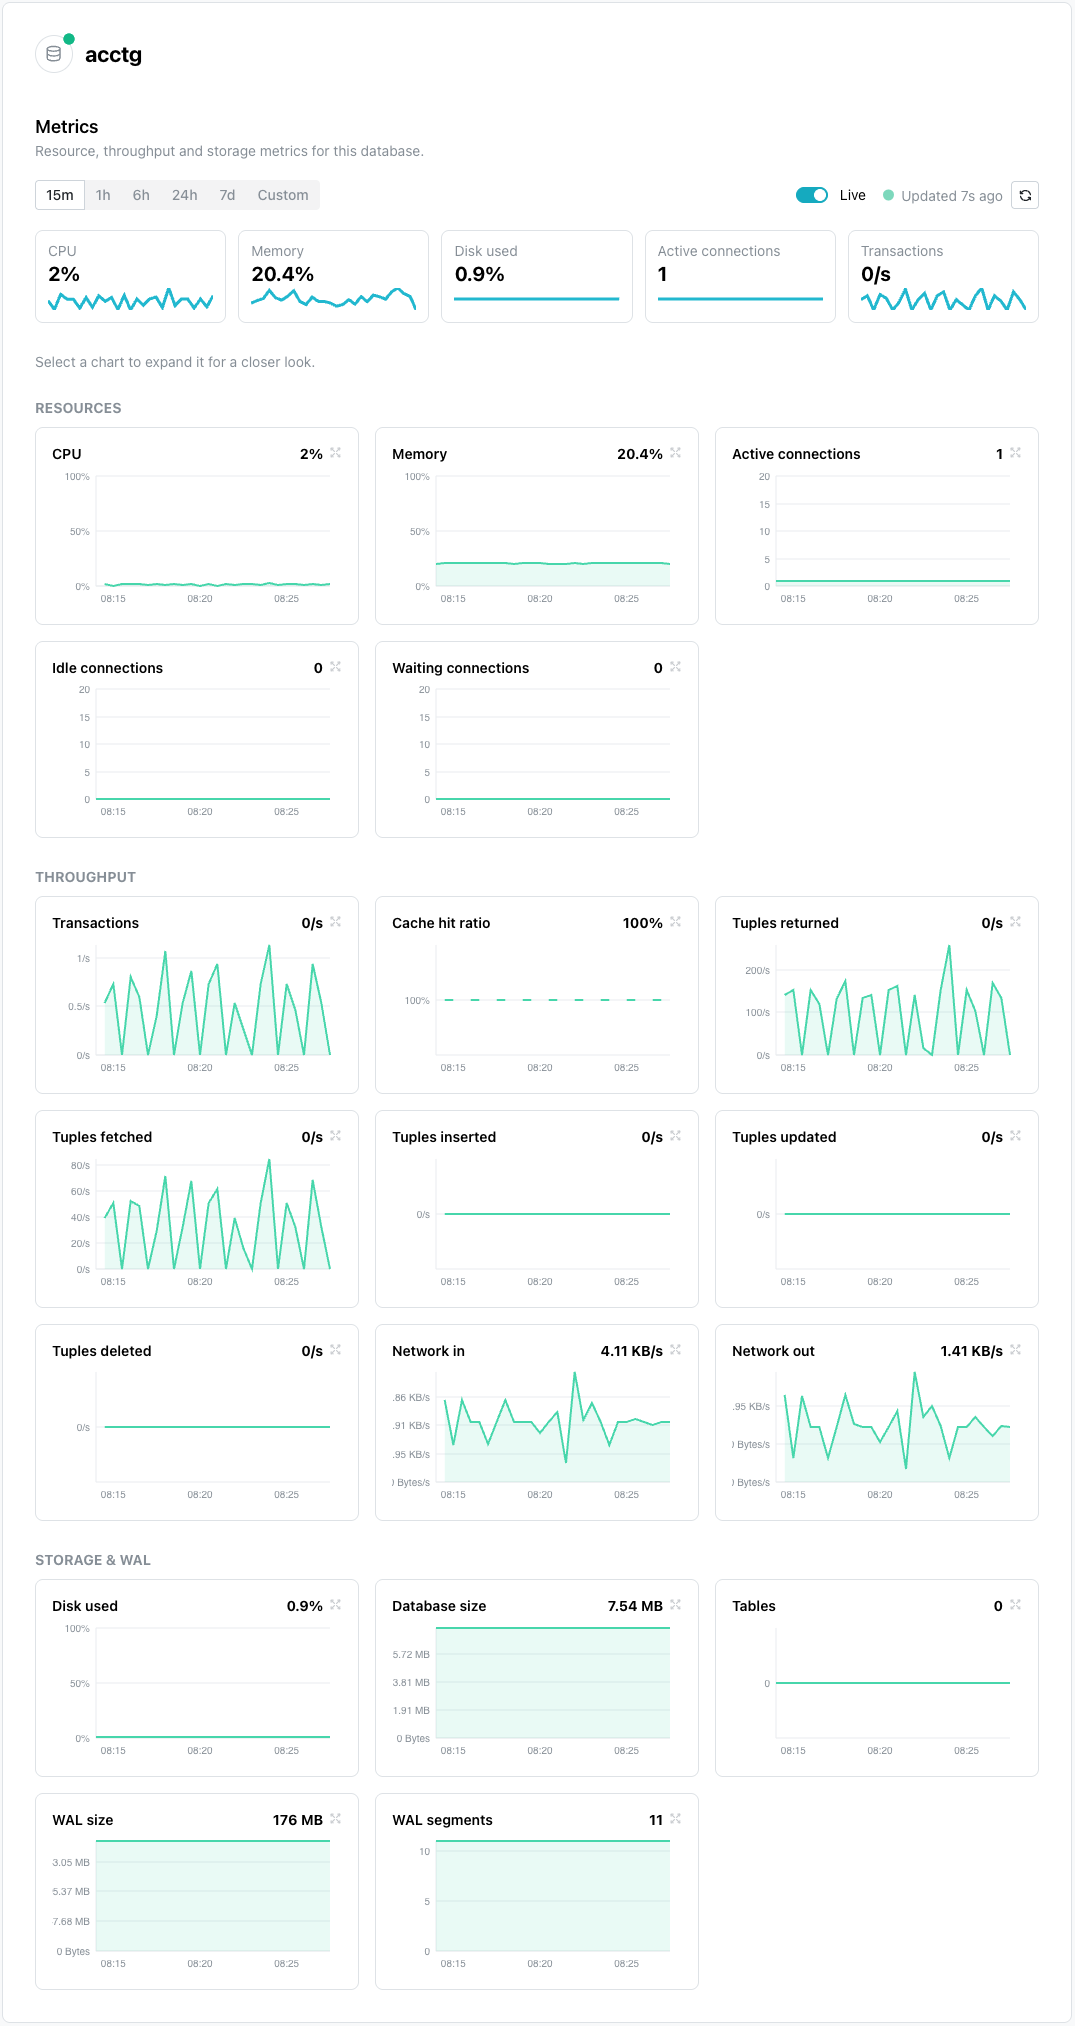
The Metrics page displays five headline tiles and nineteen charts, grouped
into Resources, Throughput, and Storage and WAL. Select any chart to
expand it for a closer look.
The header sits at the top of the Metrics page.
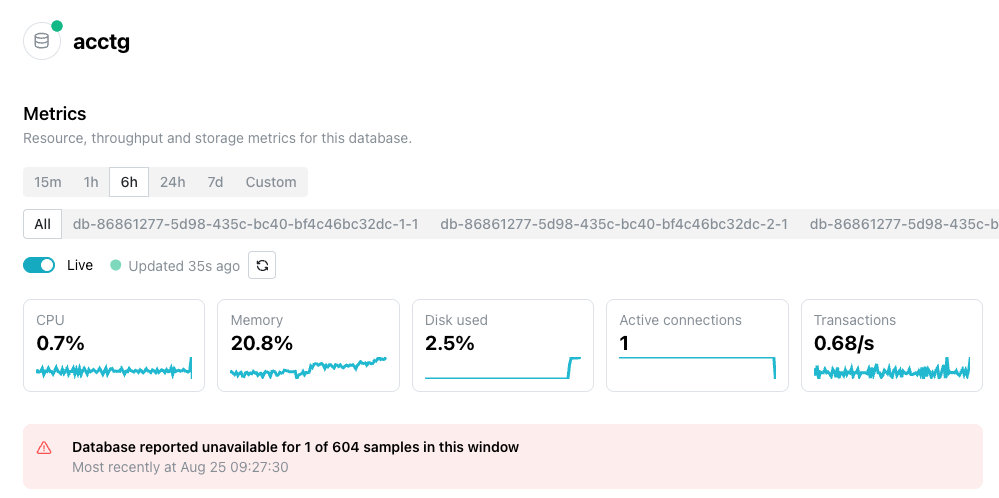
The header displays the name and status of the current database, followed by controls for the charts displayed below:
-
Use the time-range buttons (
15m,1h,6h,24h,7d, orCustom) to change the period displayed. The console remembers the choice per database. -
Use the row of buttons below the time-range buttons to display metrics for
Allreporting instances, or select a single instance to display metrics for that one only. The console marks the primary, and the row appears only when more than one instance reports. -
Toggle
Liveto enable or disable automatic updates.Liveis on by default and refreshes on a cadence set by the time range. Applying aCustomrange disables theLivecontrol. WhenLiveis enabled, the header displays how long ago the charts were last updated. Select the refresh icon to update the charts immediately.
Below the header, a row of tiles summarizes the current CPU, Memory,
Disk used, Active connections, and Transactions values, each with a small
trend graph. The tiles read from the primary instance, falling back to
whichever instance reported first when no instance is yet marked primary.
If the database was unreachable for any samples in the selected time range, a warning banner reports how many samples were affected and when the database was most recently unavailable.
Live refresh runs at a different cadence for each time range; a wider range averages the metrics to keep the graph legible. The following table displays the refresh cadence and point count for each time range:
| Time range | Refresh | Points plotted |
|---|---|---|
15m |
Every 10 seconds | Every sample |
1h |
Every 30 seconds | Every sample |
6h |
Every 60 seconds | Averaged into 120 buckets |
24h |
Every 2 minutes | Averaged into 150 buckets |
7d |
Every 5 minutes | Averaged into 180 buckets |
Understanding Metrics - Levels vs. Rates
Every chart plots metrics as either a level or a rate:
-
A level plots the value as the database reported it. A blank means the database published no metrics for that sample.
-
A rate plots the change since the previous sample, divided by the number of seconds between the two. The first point of any rate series is always blank, because there is no previous sample to subtract, and a sample whose neighbor is missing is also blank. A counter that restarts at zero, which happens when the container restarts, produces a negative difference, which the console renders as one gap rather than as a downward spike.
Resource Charts - Reference
The Resources section displays charts that track the compute and connection
resources used by your database. The following table describes each chart:
| Chart | Description | Source Metric | Metric Form |
|---|---|---|---|
| CPU | The percentage of CPU used by the database. The axis is capped at 100. | cpu_seconds_total as a rate, against cpu_quota divided by cpu_period |
Rate |
| Memory | The percentage of memory used by the database. The axis is capped at 100. | memory_used_bytes over memory_limit_bytes |
Level |
| Active connections | The number of active client connections to the database. | pg_stat_activity_active, with the axis topped by pg_settings_max_connections |
Level |
| Idle connections | The number of idle (inactive) client connections to the database. | pg_stat_activity_idle, same axis top |
Level |
| Waiting connections | The number of connections waiting for a lock or other resource to become available. | pg_stat_activity_waiting, same axis top |
Level |
Active, idle, and waiting are three separate charts, each showing a single value, not slices of a total; read them together against the connection limit the axis displays.
Throughput Charts - Reference
The Throughput section displays charts that track the amount of database
activity, including transactions and row-level operations. The following
table describes each chart:
| Chart | Description | Source Metric | Metric Form |
|---|---|---|---|
| Transactions | The number of transactions processed per second, counting commits and rollbacks together. | pg_stat_database_xact_commit and pg_stat_database_xact_rollback, each as a rate, added |
Rate |
| Cache hit ratio | The percentage of reads served from the cache instead of disk. The axis is capped at 100 and its floor follows the data. | pg_stat_database_blks_hit and pg_stat_database_blks_read as rates, hits over the two added |
Rate |
| Tuples returned | The number of rows returned by queries per second. | pg_stat_database_tup_returned |
Rate |
| Tuples fetched | The number of rows fetched from the database per second. | pg_stat_database_tup_fetched |
Rate |
| Tuples inserted | The number of rows inserted per second. | pg_stat_database_tup_inserted |
Rate |
| Tuples updated | The number of rows updated per second. | pg_stat_database_tup_updated |
Rate |
| Tuples deleted | The number of rows deleted per second. | pg_stat_database_tup_deleted |
Rate |
| Network in | The amount of network traffic received by the database per second. | network_receive_bytes_total |
Rate |
| Network out | The amount of network traffic sent by the database per second. | network_transmit_bytes_total |
Rate |
Cache hit ratio is blank rather than zero when neither hits nor reads moved
between two samples, so an idle database displays gaps here rather than a flat
line.
Storage and WAL Charts - Reference
The Storage and WAL section displays charts that track disk usage and
write-ahead log (WAL) activity for your database. The following table
describes each chart:
| Chart | Description | Source metric | Metric Form |
|---|---|---|---|
| Disk used | The percentage of allocated disk storage currently used. The axis is capped at 100. | storage_used_bytes over used plus storage_available_bytes |
Level |
| Database size | The total size of the database. | pg_database_size_bytes |
Level |
| Tables | The number of tables in the database. | pg_database_table_count |
Level |
| WAL size | The size of the write-ahead log (WAL). | pg_wal_size_bytes |
Level |
| WAL segments | The number of WAL segments currently retained. | pg_wal_segments |
Level |
Disk used expresses storage in use as a percentage of total storage:
storage in use plus storage still available.
How Reporting Lag Affects Charts
The newest point on a chart lags 1 to 2 minutes behind actual time. This lag varies within that range rather than remaining fixed at a single value. Samples are collected into buckets every 30 seconds, aligned to the start and midpoint of each minute.
A change made now does not appear on the chart immediately, so allow the lag to elapse before concluding that a query, an index, or a restart had no effect.
Setting a Custom Time Range
A range shorter than the lag will end before any sample can publish, so it returns no data. Select a range of three minutes or more: a three-minute range returns a small number of samples, and a wider range returns more.
Only a Custom range can be this short, because the console's shortest
preset button is 15m. A custom range of two minutes or less, ending
at the current time, always returns empty and displays No metrics in
this window, the same message a database with no metrics
displays.
Missing Metrics - Charts With No Data
A metric with no value in the time range is left out of the response entirely rather than sent as blank. The console does not render a chart for a metric for which it received no sample, and nothing on the page marks the absence. A narrow range therefore displays fewer charts than a wide range, with no error noted.
Hint
If a chart you expect is not on the page, widen the time range.
Metrics During a Resize or Restore
A resize or a restore moves the database onto new infrastructure; during the transition, both instances report metrics. During the handover, both instances can publish a sample for the same timestamp. The console groups samples by instance before computing metrics, so it never computes a rate across the handover and never counts the overlap twice.
The instance filter appears above the charts, with one button per instance and the primary marked, and each chart displays two lines with a legend. The instance still starting up reports no samples until it is ready, so its line displays gaps at the start.
Outside a resize or a restore, each chart displays a single line.
Troubleshooting
-
Couldn't load metricsmeans the read failed, and the panel displays aRetrybutton; select it. If retrying continues to fail while the database isAvailable, the metrics store, not the database, is the failing component. -
No metrics in this windowmeans the read succeeded and the time range held no samples. The hint under this message names a database created moments ago, or an environment without observability, as the causes. Widen the time range to allow additional time to capture metrics. -
Couldn't load this database. Please try again shortly.appears in place of the whole page when the database cannot be read at all.