Using the pgEdge Starfleet Console
When a pgEdge Starfleet PostgreSQL database finishes deploying, the console lists its name in the navigation tree control in the left-most pane.
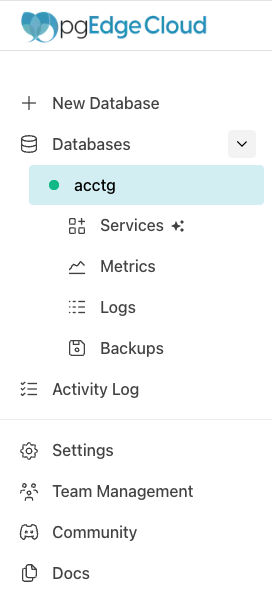
Select the database name to navigate to the database management page of the console.
The Database Header
The database header sits at the top of the database's management page.

The database header displays:
- the name of the database, with a dot next to it indicating the database's
status:
- a green dot means the database is available for connections.
- a blue dot means the database is being created.
- a red dot means the database is not available.
- the CPU size of the database.
- the memory used by the database.
- the amount of storage in use by the database, against its writable capacity.
- the number of connections allocated for the database.
The Actions Context Menu
The Actions drop-down (on the right-hand side of the header) offers
management options for your database, including editing the display name,
upgrading the size tier, and enabling deletion protection.
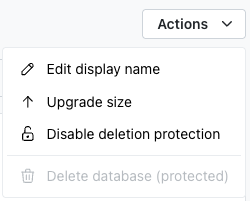
For detailed information about options available through the Actions menu,
see Accessing Management Options with the Actions Menu.
The Connect Pane
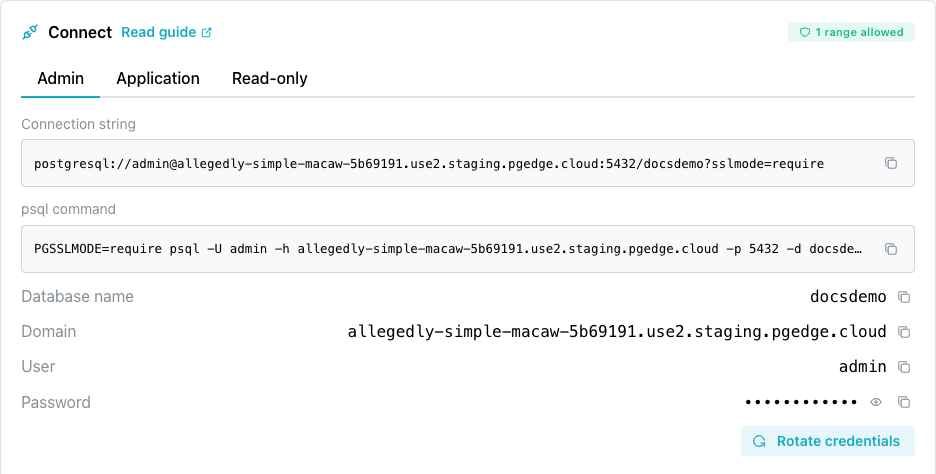
Below the header, the console displays the Connect pane; the pane includes an
Admin tab with credentials for the admin user, an Application tab
with credentials for the app user, and a Read-only tab with
credentials for the app_read_only user. Each tab displays:
- a ready-to-use
Connection string. - a ready-to-use
psql command; the command opens a psql session for the selectedUser(Admin,Application, orRead-only) when invoked on the command line of a host with an installed psql client. - the
Database nameandDomain(host name) of the database. - the
Userconnecting to the database, with aRotate credentialscontrol that generates a new password for that user. - the
Passwordfor the user, with an eye icon that reveals it.
Select the copy icon next to any field to copy its value.
The two users have different permissions on the database. Connect as app
to create tables and load data, and as admin to install a supported
extension app cannot install, such as vector, or for server-wide work.
Managing Database Roles describes what
each one can do.
The ALLOWED IP RANGES list at the bottom of the pane displays the
database allowlist, and the badge at the top of the pane displays how
many ranges are allowed. If the allowlist has no range, the pane
displays No IP addresses are allowed above the connection details,
and no client can connect with the connection string. For more information, see
Controlling Network Access.
A database that is still being created may show a provisioning message instead:
-
Couldn't load connection details. Please refresh and try again.means that the server could not read the per-role credentials. Refresh the console to retry; any connection string you already hold remains valid for login. -
Connection details are unavailable.means that the pane has a record of the database but lacks the host, port, or database name required to build a connection string. A database in thefailedstatus displays this message. Wait for the database to reach theAvailablestatus, then reload the page. -
This database is <status> and is not available to connect right now.means that the database is in a status the pane does not treat as connectable:deleting,suspending,suspended,resuming, or any status the console does not recognize. See Database Statuses for the meaning of each status.
If the console displays Couldn't load every role's credentials. The
ones shown are current; try again shortly for the rest., it was unable
to read every role's credentials. The console retries automatically,
or you can reload the page.
See the following resources for more detail:
- Connecting with psql discusses installing the psql client and connecting to the database.
- The Postgres documentation discusses Postgres SQL commands.
The AI Services Pane
The AI Services pane lists the AI-related services available for your
database.

The AI Services pane displays icons you can use to deploy available services
on your Postgres database, including an MCP Server and a RAG Server. Select
Enable MCP or Enable RAG to add a service. A running service's card
displays its address, with a copy icon. Select Details on the MCP Server
card, or Configure on the RAG Server card, to manage the service.
Each server has its own allowlist, displayed on its card. A new server starts
with no ranges, and a running server's card reads Running, but unreachable
— no ranges allowed. until its allowlist has a range. For more information,
see
Controlling Network Access.
For detailed information about enabling, configuring, and connecting to these services, see Enabling and Using the MCP Server or Enabling and Using the RAG Server.
The Backups Pane
The Backups pane displays a list of the backups taken of your database; each
backup is either a hot backup (the fastest to restore from) or a durable
backup (kept apart from the database's own storage and slower to restore).
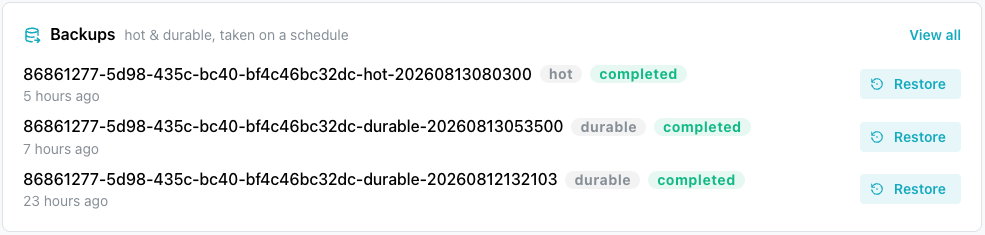
To review a complete list of available backups, select View All from the
right side of the console, across from the Backups label.
Each backup entry displays:
- the backup ID.
- a tag indicating whether the backup is a
hotordurablebackup. - the backup status (for example,
completed). - how long ago the backup was taken.
Select the Restore button, to the right of a backup, to restore that
backup; select View All (in the upper-right corner of the pane) to see the
complete list of backups.
For detailed information about the Backups page, see
Restoring from Backup.
The Metrics Pane
The Metrics pane displays live graphs of current database activity, including
Transactions (transactions per second) and Tuples returned (rows returned
per second).
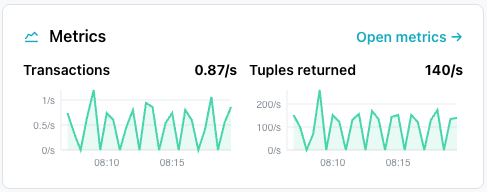
Select Open metrics (in the upper-right corner of the Metrics pane) to see
detailed metrics for your database.
For detailed information about the Metrics page, see
Monitoring System Metrics.
The Logs Pane
The Logs pane displays the most recent entries from your database's log file;
each entry displays the timestamp, log level (for example, LOG), and message.
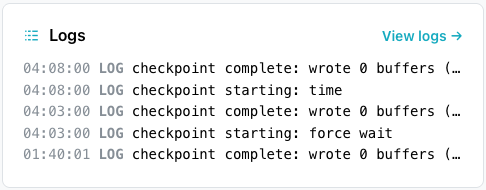
Select View logs (in the upper-right corner of the pane) to see the complete,
searchable log for your database.
For detailed information about the Logs page, see
Reviewing the Log Files.
The Branches Pane
The Branches pane lists the branches of your database, and allows
you to create one. See
Creating and Managing Branches.
Summary Panes
The Plan & billing and Details panes display the size tier, billing status,
and configuration of your database.

Plan and Billing
The Plan & billing pane displays the current size tier of your database
and what you pay after any free trial ends. Select
Upgrade size to change the size of your database. For what each size
provides, see
Managing Database Details.
If you receive a message after adding a payment method:
-
Payment saved, but we could not refresh billing status.means the console saved the card but could not re-read the billing state afterward, so reload the page. -
Still unable to load billing status.means a retry of that read failed again.
Details
The Details pane displays identifying and configuration information
about your database.
| Field | Description |
|---|---|
| Database ID | The unique identifier for the database. |
| Region | The region in which the database is deployed. |
| Postgres | The Postgres version running on the database. |
| Storage | The amount of storage allocated to the database. |
| Network | Whether the database is publicly or privately accessible, and whether TLS is enabled. |
| Created | How long ago the database was created. |
Troubleshooting
-
Couldn't load this database. Please try again shortly.means the console could not read the database record. TheMetrics,Logs, andBackupspages read the same way. Reload the page. If the error repeats, check the Databases list, because a deleted database reads this way from a bookmarked URL. -
Database not foundmeans the read succeeded and returned no record for the database ID in the URL. Go back to the Databases list, and if you expected the database to exist, check that you are in the right account.